


Understanding the Head and Shoulders Pattern
A Closer Look at $MSFT


The head and shoulders pattern is one of the most widely recognized and effective reversal patterns in technical analysis. This formation can signal a change in trend, making it a crucial aspect for traders and investors to understand. In this blog, we’ll explore the nuances of the head and shoulders pattern, focusing on Microsoft Corporation ($MSFT) and its current price action.
What is the Head and Shoulders Pattern?
The head and shoulders pattern consists of three peaks: two shoulders and a head. The left shoulder forms first, followed by the head, which is the highest peak, and finally, the right shoulder, which is typically lower than the head. This pattern indicates a potential reversal from a bullish to a bearish trend.

Key Components:
Left Shoulder: A price increase followed by a peak and a subsequent decline.
Head: A higher peak followed by a drop, creating the highest point of the pattern.
Right Shoulder: A rise to a peak that is lower than the head, followed by another decline.
Neckline: A support level drawn by connecting the lows of the declines after the left shoulder and the head.
The Current Situation of $MSFT
As of the latest trading session, $MSFT is showing signs of forming a head and shoulders pattern. The critical support level is established at $388, which traders are watching closely. This level is not just a technical support but also serves as the neckline of the pattern, adding to its significance.
Recent Price Action:
Closing Price: $433.51 (last session, Monday 23)
Key Levels:
Support Level: $388
Target for Head and Shoulders Pattern: $310 (approximately 20% decline)
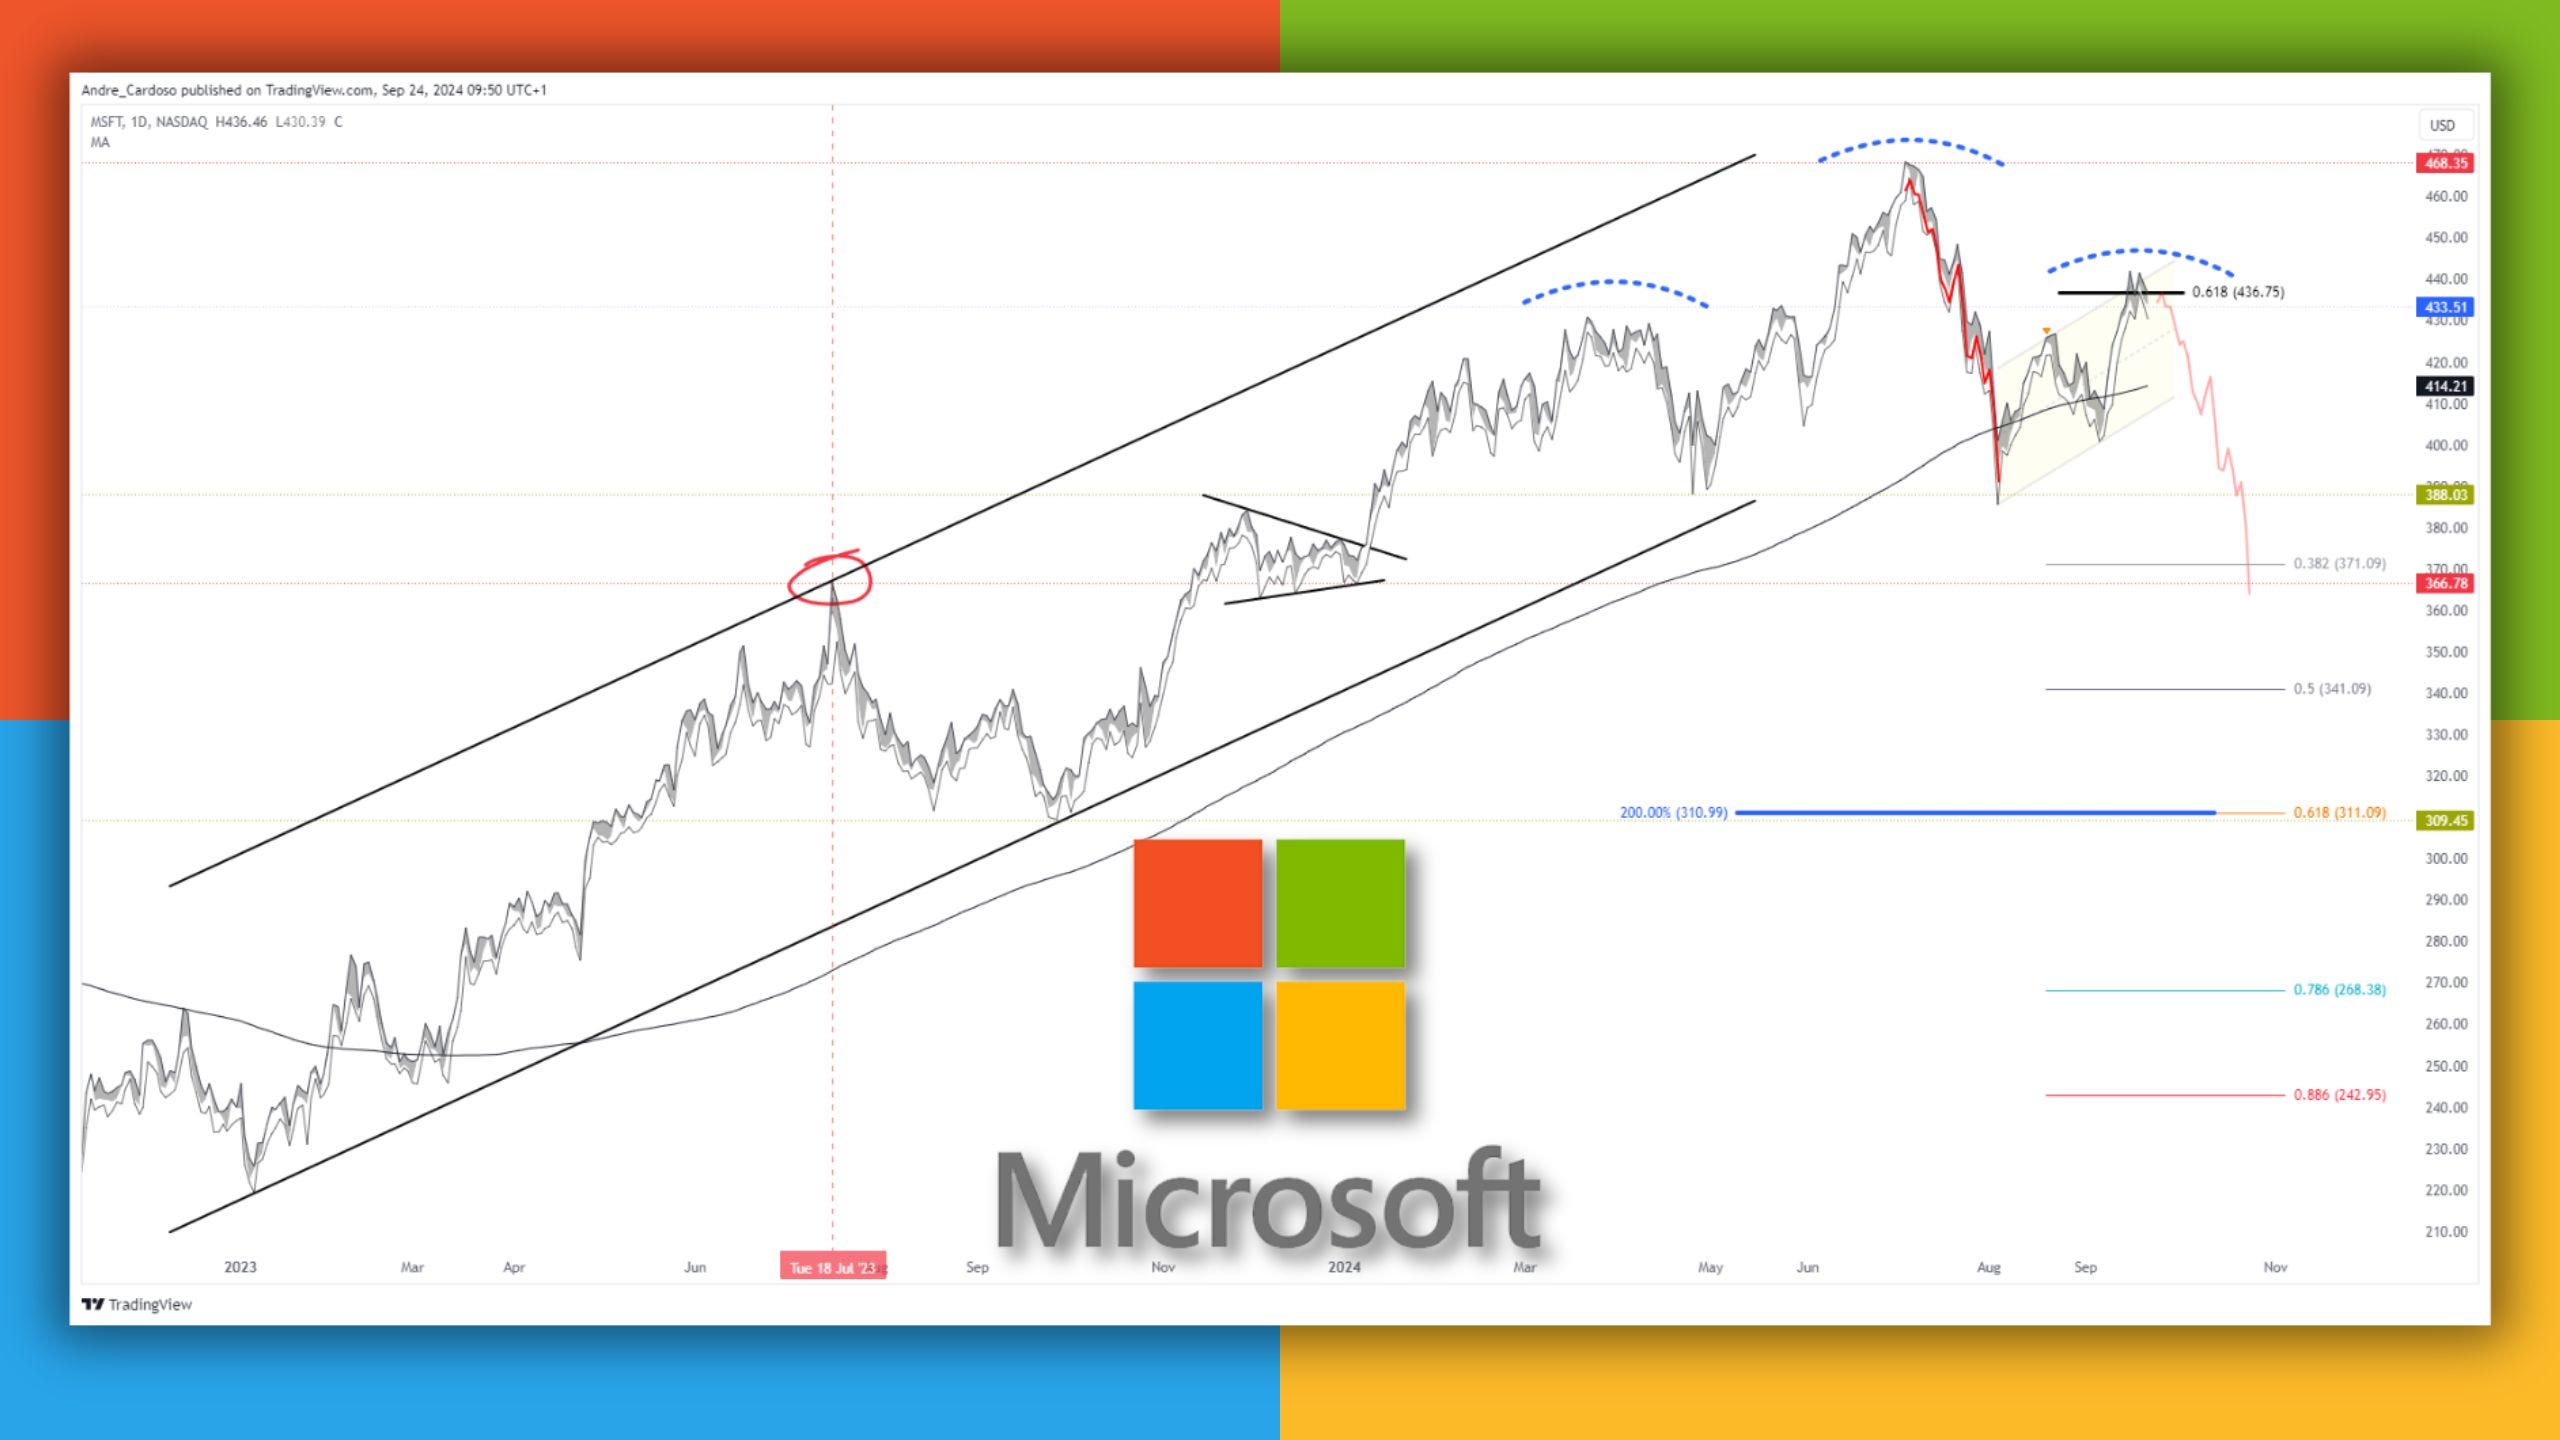
Currently, $MSFT is trading near the 61.8% Fibonacci retracement level, which is a common area where price action can reverse. The presence of this level is critical, as it may indicate potential resistance that could lead to a price decline.
The Implications of the Pattern
The head and shoulders pattern suggests a bearish outlook for $MSFT if it confirms with a breakdown below the neckline at $388. If the stock fails to hold this support, it may trigger selling pressure, pushing the price towards the projected target of $310.
Momentum Indicators: While the momentum remains bullish for the time being, traders must stay vigilant for any signs of reversal. A failure to maintain above the neckline could lead to increased volatility and a swift decline in the stock price.
Trading Strategy
For traders looking to capitalize on this potential setup, the following strategies may be considered:
Watch for Confirmation: Wait for the price to close below $388 to confirm the pattern.
Set Alerts: Use alerts at key levels ($388 for support and $310 for target) to stay updated on price action.
Risk Management: Consider stop-loss orders above the right shoulder to manage risk effectively.
Monitor Volume: Pay attention to volume trends; increasing volume on a breakdown adds to the pattern’s validity.
Conclusion
The head and shoulders pattern is a critical tool for traders looking to navigate the markets effectively. With $MSFT currently at a crossroads, understanding this pattern and its implications can help traders make informed decisions. As the situation unfolds, staying alert to key levels and potential reversals will be essential for capitalizing on market movements.
By keeping an eye on these technical indicators and the overall market sentiment, traders can position themselves strategically for potential shifts in $MSFT and the broader tech sector.
Happy Trading,
André Cardoso
